
Gold Technical Analysis: shuffling in place above $1,230.00
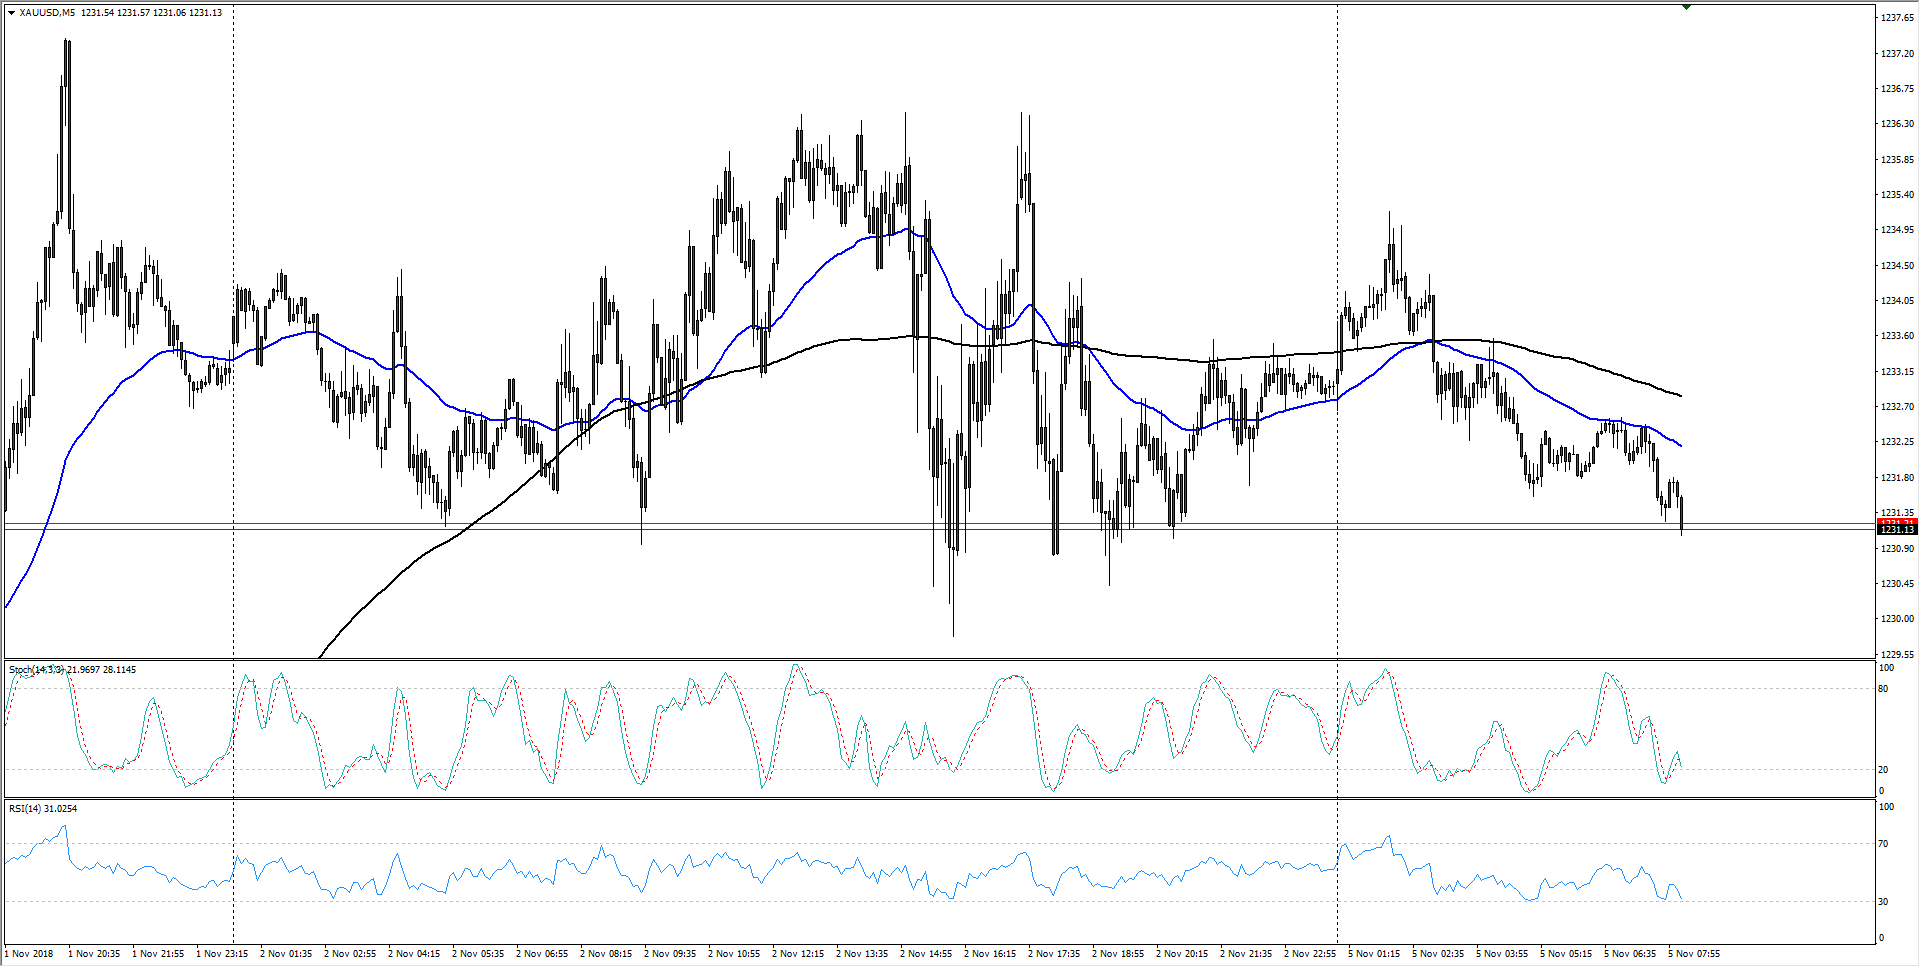
- The past twenty-four hours has seen Gold trading in a rough range from 1,230.00 to 1,236.00, and precious metals traders had a tough time picking a direction as Gold hangs around it’s non-trending 50- and 200-hour moving averages.
XAU/USD M5
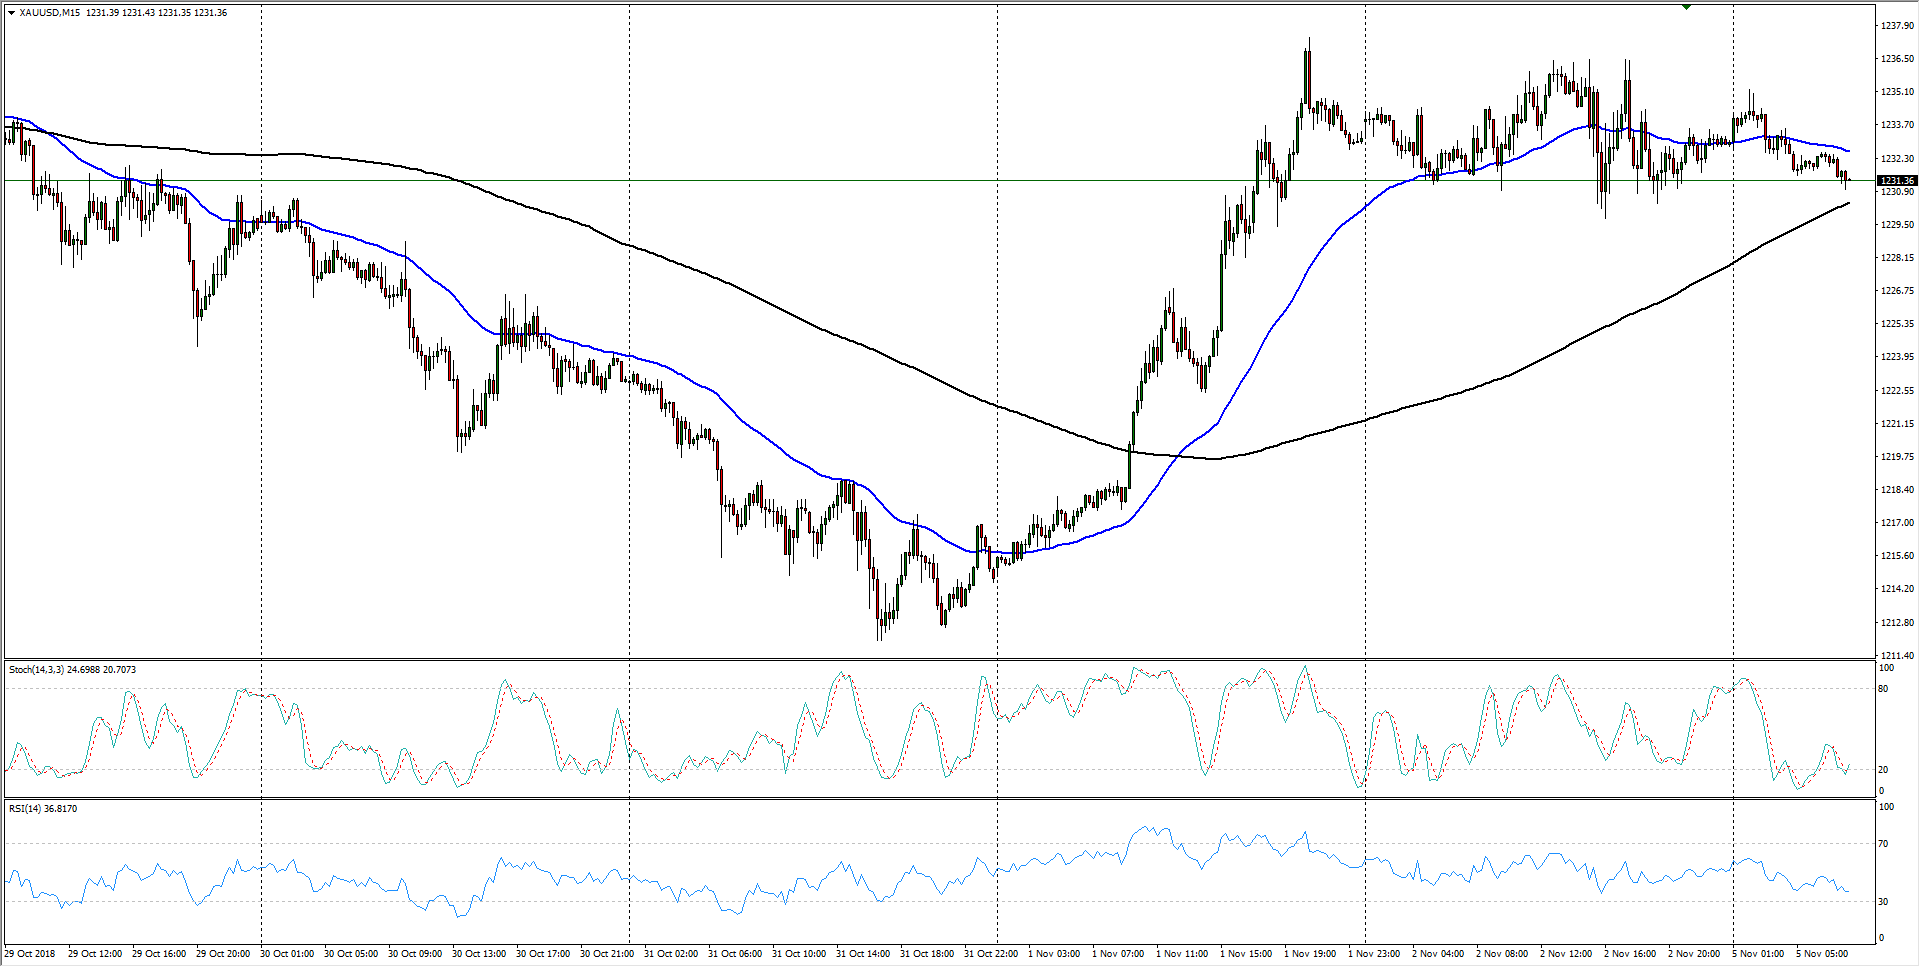
- The past week has seen Gold recover from 1,211.00 to 1,235.00, and stalled momentum could see Gold’s early-week action wrestling with support from the 200-period moving average sitting near 1,230.45 on 15-Minute candles.
XAU/USD M15
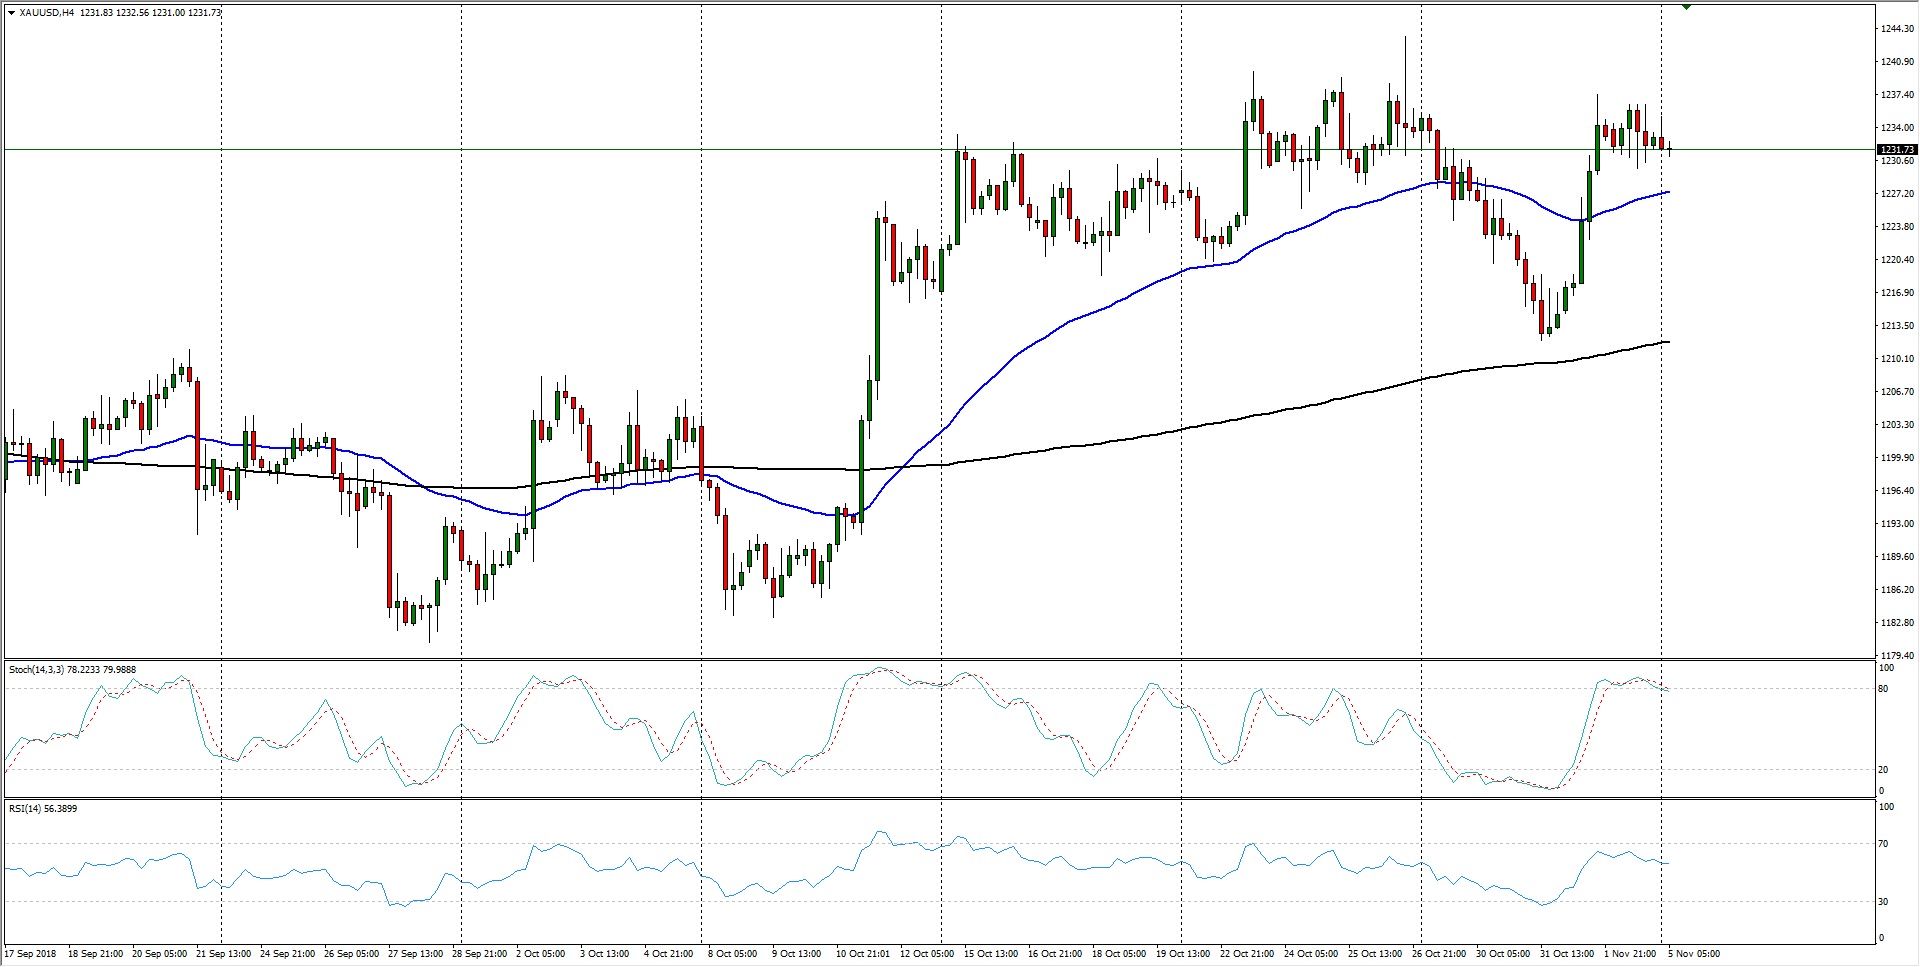
- Looking towards the medium-term, Gold continues to consolidate near the 1,230.00 level, and last week’s decline into 1,212.00 was quickly faded out by metals bidders, but goldbugs are struggling to find wheels to keep the XAU/USD moving beyond the current constraint levels.
XAU/USD H4
XAU/USD
Overview:
Last Price: 1231.3
Daily change: -1.2e+2 pips
Daily change: -0.0998%
Daily Open: 1232.53
Trends:
Daily SMA20: 1227.18
Daily SMA50: 1210.49
Daily SMA100: 1207.11
Daily SMA200: 1246.75
Levels:
Daily High: 1236.43
Daily Low: 1229.4
Weekly High: 1237.6
Weekly Low: 1211.8
Monthly High: 1243.43
Monthly Low: 1182.54
Daily Fibonacci 38.2%: 1232.09
Daily Fibonacci 61.8%: 1233.74
Daily Pivot Point S1: 1229.14
Daily Pivot Point S2: 1225.76
Daily Pivot Point S3: 1222.11
Daily Pivot Point R1: 1236.17
Daily Pivot Point R2: 1239.82
Daily Pivot Point R3: 1243.2


